- Original research
- Open access
- Published:
Assessment of forest fire severity and land surface temperature using Google Earth Engine: a case study of Gujarat State, India
Fire Ecology volume 20, Article number: 23 (2024)
Abstract
Forest fires are a recurring issue in many parts of the world, including India. These fires can have various causes, including human activities (such as agricultural burning, campfires, or discarded cigarettes) and natural factors (such as lightning). The present study presents a comprehensive and advanced methodology for assessing wildfire susceptibility by integrating diverse environmental variables and leveraging cutting-edge machine learning techniques across Gujarat State, India. The primary goal of the study is to utilize Google Earth Engine to compare locations in Gujarat, India, before and after forest fires. High-resolution satellite data were used to assess the amount and types of changes caused by forest fires. The present study meticulously analyzes various environmental variables, i.e., slope orientation, elevation, normalized difference vegetation index (NDVI), drainage density, precipitation, and temperature to understand landscape characteristics and assess wildfire susceptibility. In addition, a sophisticated random forest regression model is used to predict land surface temperature based on a set of environmental parameters. The maps that result depict the geographical distribution of normalized burn ratio and difference normalized burn ratio and land surface temperature forecasts, providing valuable insights into spatial patterns and trends. The findings of this work show that an automated temporal analysis utilizing Google Earth Engine may be used successfully over a wide range of land cover types, providing critical data for future monitoring of such threats. The impact of forest fires can be severe, leading to the loss of biodiversity, damage to ecosystems, and threats to human settlements.
Resumen
Los incendios de vegetación son eventos recurrentes en muchas partes del mundo, incluyendo la India. Estos incendios pueden tener varias causas, incluyendo actividades humanas (tales como quemas agrícolas, fuegos de campings, y descartes de cigarrillos) y factores naturales (como los rayos). Este estudio presenta una metodología comprensiva y de avanzada para determinar la susceptibilidad a los incendios mediante la integración de diversas variables ambientales y el aprovechamiento de experiencias innovadoras, mediante el uso de técnicas de aprendizaje automático, a lo largo del Estado de Gujarat en la India. El objetivo significativo de este estudio fue el utilizar el Google Earth Engine para comparar sitios en el Gujarat, India antes y después de incendios de vegetación. Datos de satélites de alta resolución fueron usados para determinar el número y tipos de cambios causados por los incendios de vegetación. Este estudio analiza meticulosamente variables ambientales (i.e. orientación de las pendientes, elevación, NDVI, densidad de drenaje, precipitación, y temperatura para entender las características del paisaje y determinar la susceptibilidad al fuego. Adicionalmente, un sofisticado modelo al azar de regresión forestal fue usado para predecir la temperatura de la superficie basado en un conjunto de parámetros ambientales. Los mapas resultantes muestran la distribución geográfica de los pronósticos del NDVI y de la temperatura en superficie, lo que provee insumos valiosos de patrones espaciales y tendencias. Los resultados de este trabajo muestran que un análisis temporal automático utilizando Google Earth Engine puede ser usado exitosamente sobre un amplio rango de diferentes tipos coberturas, proveyendo de datos críticos para monitoreo de esas amenazas. Los impactos de fuegos de vegetación pueden ser severos, llevando a una pérdida en la biodiversidad, daños en los ecosistemas, y amenazas a los asentamientos humanos.
Introduction
Forests are envisaged as a vital natural resource that conserves stability in the environment, covering approximately one-third of the earth’s surface (Keenan et al. 2015). They play a crucial role as essential environmental resources and generate about two-thirds of the world’s oxygen (McKinley et al. 2011). Before industrialization, forests spanned approximately 5.9 billion hectares of the earth’s land surface, but presently, they encompass around 4 billion hectares. Despite their significance, extreme conditions are vulnerable to the effects of climate change, anthropogenic activities (Gupta et al. 2022c; Mckinley et al. 2011; Omar et al. 2017, 2022; Singh et al. 2023), and various disasters like drought (Gond et al. 2023a, b; Gupta et al. 2022a), flood (Abhash et al. 2023; Jodhani et al. 2023b; Shivhare et al. 2016), changes in the channel planforms (Jodhani et al. 2024) shoreline change (Jodhani et al. 2021) landslides, pests (Lecina-Diaz et al. 2021), and forest fires. Notable devastating wildfires in recent times have occurred in Australia, the Amazon region, the United States (Hantson et al. 2015), and various forest areas in Iran (Ghorbanzadeh et al. 2019). Forest fires stem from two main factors: human activities (exemplified by practices like deforestation) (Cochrane 2001; Skole and Tucker 1993) and natural events such as lightning strikes. The impact of forest fires has been extensively documented across various dimensions, including biodiversity (Granström 2001), human life (Fowler 2003), climate change (Wotton et al. 2010), and their associated economic ramifications (Kim et al. 2019; Molina et al. 2019). A significant 55% of India’s forests are vulnerable to intermittent fires, as reported by the Forest Survey of India in 2011. Moreover, the escalating population growth in India has led to substantial deforestation, further exacerbating the fragmentation of existing forested areas (Omar et al. 2017). The aftermath of these fires involves severe damage to burned forests, and the substantial presence of combustible wood markedly increases the likelihood of recurrent forest fires (Siegert et al. 2001). The impact of these fires is exacerbated by climate change, as higher land surface temperatures create favorable conditions for their outbreak (Omar and Kumar 2021). Various traditional and advanced techniques were implemented to understand the trend and variability of extreme conditions (Gupta et al. 2021a, b, 2022b, 2023).
Various tools have been employed for the analysis and mapping of forest fire susceptibility. These tools include satellite imaging technology (Hernandez-Leal et al. 2006), geographic information systems technology (Kumar Jaiswal et al. 2002; Teodoro and Duarte 2013), fire area simulators with probabilistic models (Krasnow et al. 2009), fuel moisture content assessment (Chuvieco et al. 2004), multivariate logistic regression (Pourghasemi 2016), and generalized additive models (Pourtaghi et al. 2016). Additionally, multi-criteria decision-making techniques, such as the analytic hierarchy process (Pourghasemi et al. 2016), and stepwise weight assessment ratio analysis have been applied (Jaafari and Pourghasemi 2019). Recently, there has been a rise in both the frequency and intensity of wildfires, necessitating advanced prediction methods; studies have reported the use of artificial neural networks and machine learning as modeling approaches to achieve high accuracy in forest fire susceptibility analysis: fuzzy logic (Abedi Gheshlaghi et al. 2020), artificial neural networks (Satir et al. 2016), adaptive neuro-fuzzy inference systems, and ensemble models of metaheuristics algorithms (Moayedi et al. 2020), classification and regression trees (CART) (Amatulli et al. 2006), boosted regression trees (BRTs) (Pourghasemi et al. 2020; Pourtaghi et al. 2016), and random forest (RF) algorithms. Modern machine learning (ML) models have demonstrated their ability to effectively handle non-linearity issues in spatial simulation, modeling, and mapping—particularly in the context of natural hazard susceptibility mapping (Shabani et al. 2021). Machine learning algorithms can be used as soft computing models when statistical limitations are low (Jodhani et al. 2023a; Pourghasemi et al. 2020). Machine learning algorithms, especially random forest (RF) (Breiman 2001; Kam Ho 1995), have become valuable tools for wildfire prediction, utilizing data analysis and modeling techniques to identify patterns and make predictions. Google Earth Engine (GEE), accessible at November 03, 2023 https://earthengine.google.com, stands out as a cloud-based platform for processing satellite imagery. Renowned for its high computational speed, GEE offers ease of application across extensive geographic areas (Gorelick et al. 2017; Jodhani et al. 2023c).
This study delves into the intricate relationships between environmental factors and fire vulnerability, focusing on predictive modeling techniques with an emphasis on key indicators such as land surface temperature (LST), normalized burn ratio (NBR), and differenced NBR (dNBR). Prediction of forest fire occurrence probability was carried out using an ensemble machine learning algorithm for Madhya Pradesh and Chhattisgarh (Surbhi Singh and Jeganathan 2023). The research (Van Wagtendonk et al. 2004), centered in Gujarat’s forest region, utilizes diverse datasets capturing landscape characteristics like aspect (Pourtaghi et al. 2016), elevation (Jaafari and Pourghasemi 2019), NDVI (Eskandari et al. 2021), drainage density, precipitation (Bui et al. 2016), slope (Chen et al. 2016; Ljubomir et al. 2019), and temperature (Verde and Zêzere 2010). Understanding the fire behavior and spread in the region needs a prior idea of the relationship between existing topography, vegetation characteristics, and local climate. Changes in the aforementioned factors are greatly influenced by human disturbances and produce unintended consequences.
Understanding the factors that influence fire occurrence and its environmental and socio-economic consequences is required for the sustainable management of forests in the Gujarat state, western region of India. Our study aims to generate a fire susceptibility map on Google Earth Engine by combining normalized burn ratio (NBR) and land surface temperature (LST) with random forest (RF) to identify forest fire susceptible zones by spatial clustering of fire incidences with prevailing fire-responsible variables. The main tasks of the study are (i) selection of data and preparation of shapefile for Gujarat state; (ii) identification of factors, processing in GEE, and map generation; (iii) NBR and dNBR calculation; (iv) LST prediction; and (v) fire susceptibility mapping. Implement a random forest model on GEE, training it to predict susceptibility based on NBR, LST, and additional features. The fire susceptibility map was prepared with five classes very low, low severity, moderate, high severity, and very high. The variables are supposed to reveal the effect of natural conditions in the study area, the importance of fire occurrence assessment, and susceptibility prediction. Overall, the novelty and research gap addressed by this study make it an important contribution to the field of environmental management and conservation for the well-being of human society. The results of the study will provide valuable insights into the factors that contribute to forest fire susceptibility in western India and inform strategies for reducing the risk of future fires.
Study area and data used
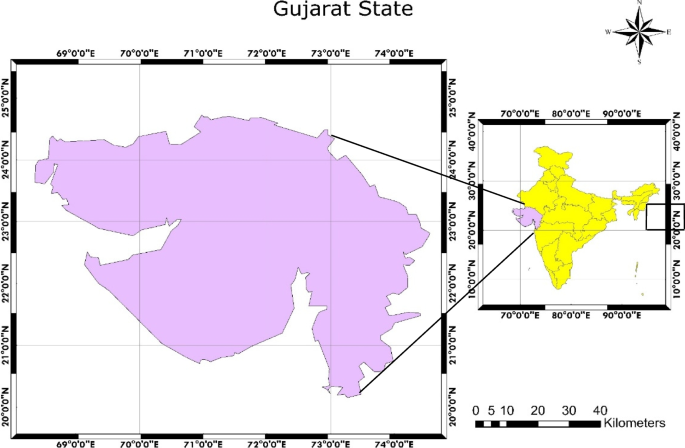
Gujarat state, located on India’s west coast, lies between latitude 20°06′ to 24°42′ N and longitude 68°10′ to 74°28′ E and has a diverse natural environment with diverse ecosystems, including vital lush forests for biodiversity (Fig. 1). The state’s arid and semi-arid climate exacerbates its vulnerability to common forest fires. The aridity poses a potential threat to farmlands and crops, necessitating a thorough understanding of fire severity to intervene in time. Over the past four decades, a decadal analysis revealed a notable increase in the number of moderate and severe heat wave days (Ray et al., 2013). High temperatures and low rainfall during the summer months increase the fire risk, while the monsoon season from June to September provides relief with moderate to heavy rainfall.
Gujarat’s diverse woodland areas encompass a range of forest ecosystems, comprising tropical deciduous forests, thorn forests, and mangrove forests. These habitats are host to a significant array of pivotal tree species, such as teak, bamboo, Sal, and acacia, contributing to the region’s rich ecological diversity. However, the dry and hot temperature makes the flora very combustible at times, posing a huge danger to the region’s biodiversity and natural ecosystems. Another significant goal of the study is to utilize Google Earth Engine to compare places in Gujarat, India, before and after forest fires. The study also attempts to analyze high-resolution satellite data to assess the amount and types of changes caused by forest fires Table 1. This study will offer insight into how these fires alter ecosystems, landscapes, and environmental conditions for determining the intensity of a forest fire. Forested regions are frequently encroached upon because of rapid development. Understanding the influence of diverse plant and animal species on forest fire intensity is critical for conserving biodiversity. Machine learning algorithms, especially random forest (RF) (Breiman 2001; Kam Ho 1995), have become valuable tools for wildfire prediction, utilizing data analysis and modeling techniques to identify patterns and make predictions. Google Earth Engine (GEE), accessible at November 03, 2023 https://earthengine.google.com, stands out as a cloud-based platform for processing satellite imagery.
Methodology
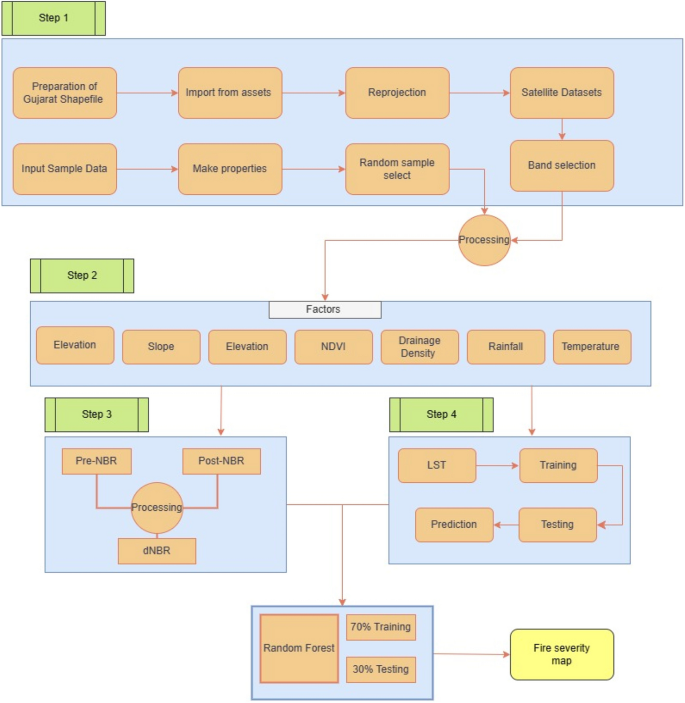
To fully understand landscape characteristics and assess wildfire susceptibility, this study meticulously analyzes various environmental variables such as slope orientation, elevation, NDVI, drainage density, precipitation, and temperature. Beginning with a novel slope orientation derivation formula, the study employs cutting-edge remote sensing techniques to acquire elevation data, providing insights into terrain variations, slope dynamics, and drainage patterns. NDVI values are critical in assessing vegetation health and identifying fire-prone areas. Furthermore, the study incorporates drainage density, CHIRPS annual precipitation, and temperature into a holistic fire risk assessment model, which considers a variety of meteorological, topographic, and vegetation-related parameters. Using Landsat satellite imagery, the calculation of the normalized burn ratio (NBR) and the difference NBR (dNBR) provides a quantitative measure of the severity of fire impact on landscapes. In addition, a sophisticated random forest regression model is used to predict land surface temperature (LST) based on a set of environmental parameters. The maps that result depict the geographical distribution of NBR, dNBR, and LST forecasts, providing valuable insights into spatial patterns and trends. The flow of the recent works is illustrated in Fig. 2.
In step 2
Aspect
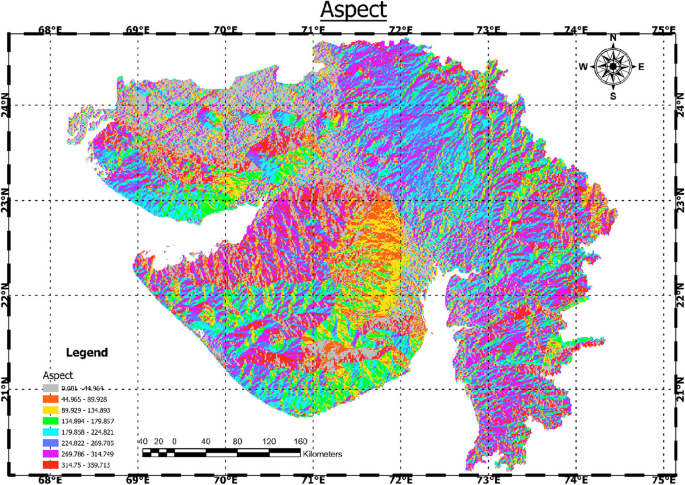
It is a dataset that gives useful insights into slope orientation, as well as information on the directional alignment of landforms and probable fire paths. This dataset’s aspect variable is produced via the derivation of aspect values using the digital elevation model (DEM). In this instance, aspect refers to the compass direction that a slope faces. The aspect values are derived from the DEM and represent the compass direction of each slope. These numbers normally vary from 0 to 360 degrees, representing the azimuthal orientation.
dz is the elevation change over a given distance dx or dy. The change in longitude is denoted by dx, and the change in latitude is denoted by dy.
The result (A) is expressed in radians and then converted to degrees (Eq. 1). This formula helps determine a slope’s orientation based on changes in elevation along the x and y axes. Notably, aspect values offer crucial information for understanding topographical features in geographic information systems (GIS) or remote sensing applications, such as how sunlight exposure varies across landscapes and helps determine fire susceptibility.
Elevation
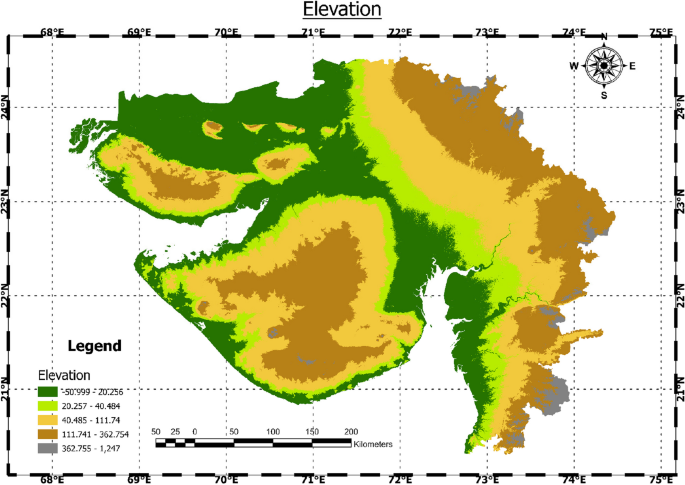
Data provides a thorough picture of the terrain’s height, which aids in understanding how topography affects fire dynamics. The elevation variable represents the vertical position of the land surface concerning sea level and influences the physical features of the landscape. Elevation data is produced from a digital elevation model (DEM) and is commonly given in meters or feet. This data facilitates the understanding of terrain height variations, which can significantly influence aspects, slope, drainage patterns, and fire behavior. Elevation cannot be calculated in a single, universal formula; however, data are often acquired through a range of remote sensing techniques, including satellite measurements, aerial surveys, or altimetry. At a specific place, elevation is expressed as a numerical value.
NDVI
It is an essential metric for evaluating the amount and quality of the vegetation as well as the susceptibility of individual plants to the spread of fire. A popular vegetation indicator is the normalized difference vegetation indicator, which is calculated from reflectance values derived from remote sensing data in the red and near-infrared bands (Eq. 2).
The following equation expresses the NDVI calculation:
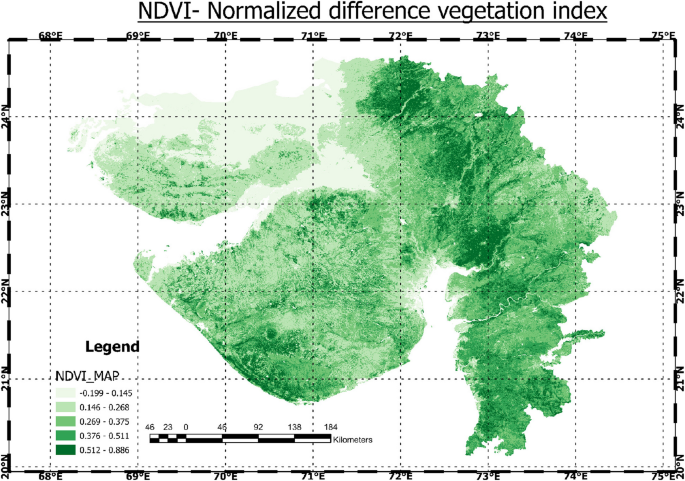
\({\text{N}\text{D}\text{V}\text{I}}_{\text{b}\text{a}\text{n}\text{d}}\) the values in the “NDVI” band of the MODIS MOD13Q1 image. The division by 10,000 is applied to scale the NDVI values back to their original range. Resulting NDVI values typically range from − 1 to 1, with distinct interpretations, where negative values indicate non-vegetated surfaces and close to zero values indicate sparse or stressed vegetation. Values close to 1 signify healthy and dense vegetation. These NDVI values provide valuable information about the level of greenness and vitality of vegetation, aiding in the identification of areas prone to fire risk and supporting effective wildfire management strategies.
Drainage density
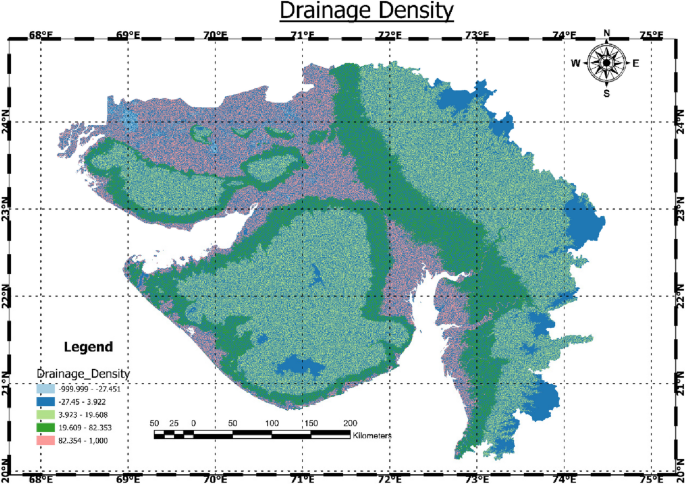
This dataset provides a quantitative estimate of the density of stream channels in each geographic area, offering helpful information about soil moisture content and fire risk in the area. The drainage density is calculated using the ratio of Flow Accumulation Scaled to the Digital Elevation Model (DEM) (Eq. 3). The concentration of flow accumulation about elevation is represented by this ratio, which shows how dense or concentrated the drainage network is at the specified location.
The following is the mathematical formula for estimating drainage density (DD) using Flow Accumulation Scaled (FA) and DEM:
Flow Accumulation Scaled reflects the cumulative flow of water throughout the landscape, scaled to account for topographical changes, and DEM refers to the Digital Elevation Model, which provides the terrain’s elevation values. The resulting drainage density values show the distribution of stream channels across the landscape concerning elevation. Elevated ratings for drainage density could suggest a more intricate and interconnected system of streams, potentially influencing soil moisture content and consequently the area’s susceptibility to wildfires.
Precipitation
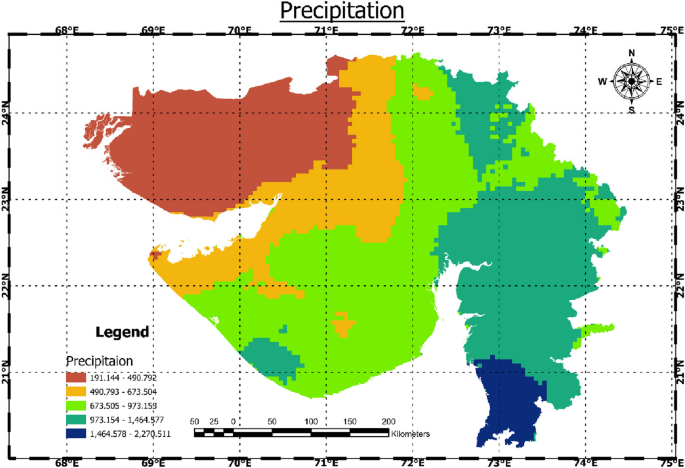
Information is essential, especially historical information, to comprehend a landscape’s moisture content, which is a major component of fire risk. The CHIRPS Image Collection is used in this study to calculate annual precipitation. Filtering the CHIRPS collection for each year, totaling the precipitation values for individual pixels, and then aggregating this information to generate a picture reflecting the yearly precipitation are all part of the process.
The formula for calculating annual precipitation Pannual is expressed as the summation of precipitation values Pi for each pixel over the specified time range given in Eq. 4:
Pi represents the precipitation value for each pixel in the CHIRPS dataset for the ith year, and the total number of years in the specified time range is denoted by n. This equation, in essence, collects the cumulative precipitation for each pixel across numerous years, providing a complete assessment of yearly precipitation for a specific region. This yearly precipitation data is critical for understanding the moisture conditions in the landscape, which influences the evaluation of fire risk in the study region.
Temperature
Data is a fundamental component that offers critical insights into the prevailing climatic conditions, exerting a significant influence on both fuel moisture levels and the likelihood of fire ignition. This information is crucial for assessing the environmental conditions that can either mitigate or exacerbate the risk of wildfires. Data is a crucial component that provides critical insights into the current meteorological conditions, which have a substantial impact on both fuel moisture levels and the possibility of fire ignition. This data is critical for understanding environmental variables that might either reduce or increase the danger of wildfires.
Because of variances in the models employed, the specific equation for ambient temperature (T) does not have a widely recognized form, although it often requires the measurement of air temperature in degrees Celsius or Fahrenheit. Temperature, for example, might be included among other elements in a more thorough fire risk assessment model. An example Eq. 5 might be:
Temperature represents the ambient temperature and k1 Fuel Moisture signifies the moisture content in vegetation. The (k1, k2, lots) terms represent weights assigned to each factor, indicating their relative importance in influencing fire risk. The specific values of these weights would be determined based on empirical observations and modeling efforts specific to the study area. In practice, the link between temperature and fire danger is frequently more subtle, and it may be part of a wider prediction model that considers a variety of meteorological, topographic, and vegetation-related parameters. Temperature analysis in conjunction with other variables gives a fuller knowledge of the circumstances that contribute to fire susceptibility.
In step 3
NBR and dNBR calculation
The calculation of the normalized burn ratio (NBR) for both pre-and post-fire situations is an important stage in the research process. The difference NBR (dNBR) is produced by subtracting post-fire NBR from pre-fire NBR using the information inherent in the NDVI dataset. This quantitative metric provides vital insights about the severity of the fire’s impact on the landscape, laying the groundwork for comprehending the fire’s ecological implications. NBR is typically derived from Landsat satellite imagery, which captures multi-spectral data. It is calculated using the near-infrared (NIR) and short-wave infrared (SWIR) bands provided in Eq. 6:
Positive values of NBR indicate healthy vegetation and negative values suggest burned or bare surfaces. The magnitude of negative values in the NBR can be indicative of the severity of fire damage (Eq. 7).
dNBR is computed by subtracting the post-fire NBR from the pre-fire NBR:
Positive dNBR values represent an increase in vegetation (post-fire recovery) and negative dNBR values indicate a decrease in vegetation, which corresponds to the severity of fire damage. More negative values generally imply higher severity.
Step 4
LST prediction
To forecast land surface temperature (LST), the study applies sophisticated machine learning techniques, notably a random forest regression model. To forecast LST, this model uses the specified environmental characteristics (aspect, elevation, NDVI, drainage density, precipitation, slope, and temperature) as features. The model assures accuracy and dependability in forecasting future temperature conditions by going through a thorough training procedure using historical data with known LST values. Machine learning improves prediction capacities, allowing for a more detailed knowledge of temperature changes driven by external variables. Analyze the impact of each environmental element on LST fluctuations. Some machine learning models, such as random forest, offer feature significance scores that reflect how much each feature contributes to the model’s predictions.
Visualization, interpretation, and reporting
A map depicts the geographical distribution of NBR, dNBR, and LST forecasts. Color ramps and legend scales have been carefully chosen to make it possible to effectively communicate the severity or magnitude of each variable. This visual depiction is critical for understanding geographical patterns, trends, and specific regions of interest. The use of modern visualization tools converts complicated statistics into accessible and usable insights, assisting academics and stakeholders in understanding the environmental elements that influence fire vulnerability. Observe geographic patterns and fluctuations in vegetation health and fire severity by visualizing the calculated NBR and dNBR pictures. The graphical findings are thoroughly analyzed to reveal geographic patterns and detect the deep linkages between environmental elements and fire-related variables. The study findings are compiled into a complete report that presents significant insights, ramifications, and prospective applications. Expert opinion, statistical analysis, and contextualization of data within the larger fields of environmental science and fire ecology are all part of the interpretation step.
Results
The fire susceptibility assessment involves the utilization of seven key factors (aspect, elevation, slope, NDVI, drainage density, precipitation, temperature) processed through Google Earth Engine (GEE). Additionally, preNBR (normalized burn ratio) and postNBR, along with land surface temperature (LST), were derived based on these identified factors. These factors served as crucial input variables in the analysis using random forest for fire susceptibility mapping.
Aspect
The aspect factor, which has significant importance in terrain analysis, refers to the compass direction that a slope faces. It is an important topographic variable that influences the distribution of solar radiation, wind direction, temperature, and moisture on a landscape. Understanding the relation of the aspect factor with fire susceptibility mapping is crucial for comprehending how terrain characteristics contribute to the likelihood of wildfires as shown in Fig. 3.
Elevation
The correlation between elevation and fire susceptibility is intricate, entwining temperature nuances, vegetation diversity, topographical intricacies, and human interventions. By infusing elevation data into fire susceptibility mapping, a richer comprehension of the terrain emerges. Elevation (Fig. 4), acting as a linchpin, unveils temperature gradients influencing ignition likelihood, delineates vegetation shifts impacting fuel dynamics, and unravels topographical configurations shaping fire behavior.
NDVI
The normalized difference vegetation index (NDVI) is integral to fire susceptibility mapping, serving as a key indicator of vegetation health and density. High NDVI values signify lush, dense vegetation, highlighting potential fuel sources for fires indicated in the southern part of Gujarat in Fig. 5. Conversely, low NDVI may indicate stressed or sparse vegetation prone to ignition, as shown in the northeastern part of the Kutch region in Fig. 5. Integrating NDVI into mapping provides a nuanced understanding of spatial vegetation dynamics, aiding in the identification of high-risk areas. Its temporal analysis captures seasonal variations and contributes to early detection. By considering NDVI alongside other factors, such as topography and weather, fire susceptibility mapping becomes a robust tool for comprehensive wildfire risk assessment and mitigation strategies.
Drainage density
Drainage density, representing the concentration of watercourses in a landscape, plays a pivotal role in fire susceptibility mapping. Higher drainage density often indicates increased moisture availability, acting as a natural barrier against wildfires. Areas with lower drainage density, conversely, may experience drier conditions, elevating the risk of ignition and fire spread as indicated in Fig. 6. Integrating drainage density into susceptibility mapping facilitates the identification of regions where limited water presence may amplify fire susceptibility. This hydrological factor complements other variables, such as vegetation and topography, providing a comprehensive understanding of the landscape. The inclusion of drainage density enhances the accuracy of mapping, aiding in targeted wildfire risk assessment and mitigation strategies.
Precipitation
Precipitation is a critical factor in fire susceptibility mapping, influencing fuel moisture content and overall fire risk. Adequate rainfall reduces vegetation dryness, acting as a natural deterrent to wildfires. Conversely, prolonged periods of low precipitation contribute to drought conditions, increasing the likelihood of ignition and fire spread. Integrating precipitation data (Fig. 7) into susceptibility mapping enables the identification of areas susceptible to dry spells and heightened fire risk. Seasonal precipitation patterns also inform temporal variations in susceptibility. By considering precipitation alongside factors like vegetation and topography, mapping becomes a comprehensive tool for assessing and mitigating wildfire risks, aiding in the allocation of resources for effective fire management strategies.
Slope
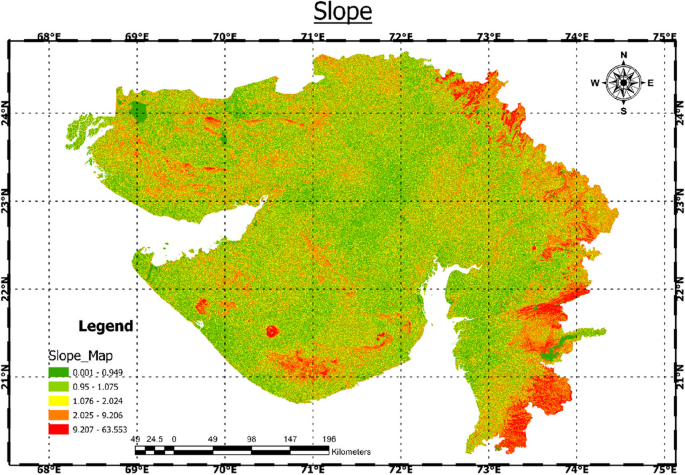
Slope inclination is pivotal in fire susceptibility mapping due to its influence on fire behavior. Steeper slopes accelerate fire spread, intensifying the risk, while flatter terrain may impede it. The topography affects wind patterns and moisture retention, further shaping fire dynamics. Integrating slope data into susceptibility mapping enables the identification of areas prone to rapid fire propagation. High slopes often correlate with increased fuel availability, amplifying susceptibility. This topographical factor, when coupled with other variables like vegetation and climate, enriches the mapping’s accuracy. Consideration of slope (Fig. 8) in fire susceptibility analysis provides valuable insights for targeted mitigation strategies and resource allocation.
Temperature
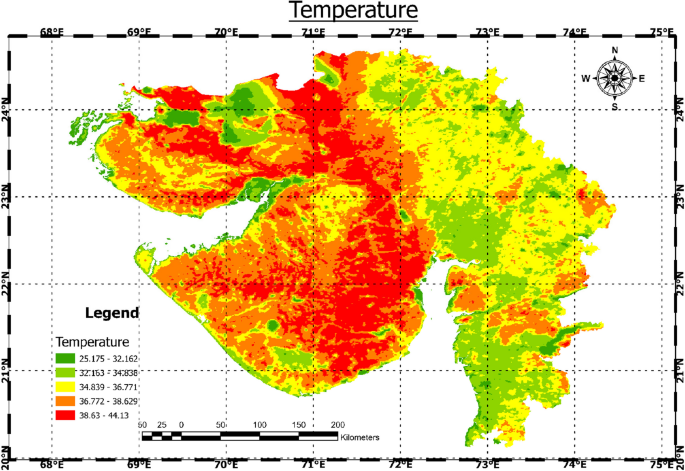
Temperature is a crucial determinant in fire susceptibility mapping, intricately influencing various factors that contribute to wildfire risk. Higher temperatures elevate the likelihood of vegetation drying, creating favorable conditions for ignition. Warm temperatures also accelerate evaporation, reducing soil moisture content and increasing the flammability of vegetation. Integrating temperature data into susceptibility mapping allows for the identification of regions experiencing prolonged periods of high temperatures, signaling heightened fire risk. Temperature fluctuations influence the duration and severity of fire seasons, impacting the overall susceptibility of an area. Warmer climates can extend fire seasons and intensify fire behavior. Moreover, temperature influences atmospheric conditions, affecting wind patterns that, in turn, influence fire spread. In fire-prone regions, mapping temperature patterns (Fig. 9) aids in recognizing areas prone to extreme heat, enhancing the precision of risk assessments. This information is invaluable for implementing targeted preventive measures, resource allocation, and developing effective strategies for wildfire management and mitigation. Overall, the relationship between temperature and fire susceptibility is fundamental, underscoring the need to incorporate temperature data for a comprehensive understanding of wildfire risk.
NBR
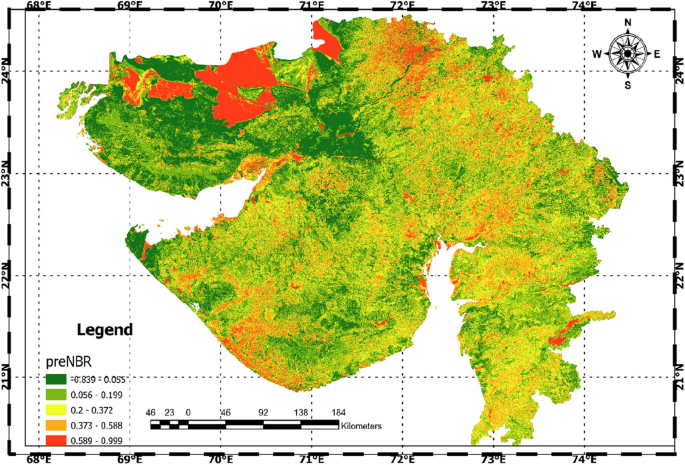
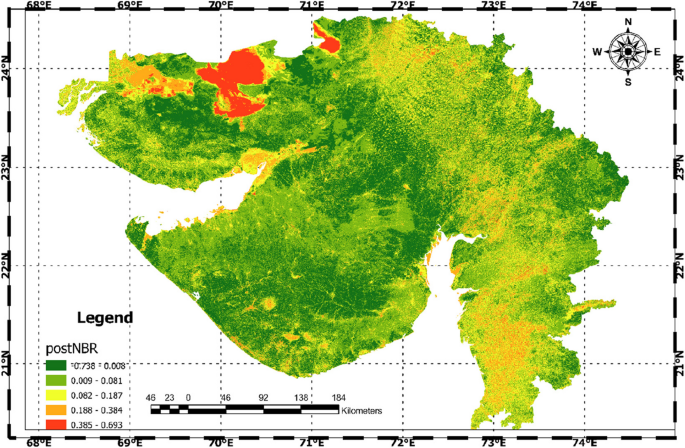
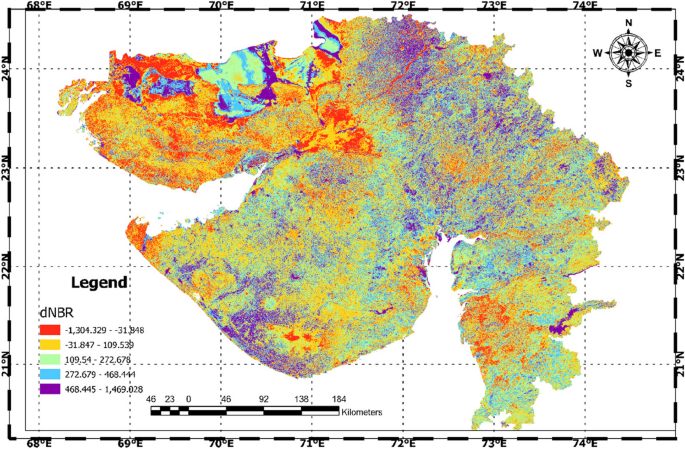
The integration of pre- and post-normalized burn ratio (NBR) into fire susceptibility mapping is instrumental in understanding and predicting wildfire behavior. NBR is a remote sensing index that quantifies the severity of vegetation burns, providing crucial insights into landscape changes caused by fires. Analyzing both pre- and post-NBR values facilitates a comprehensive assessment of fire susceptibility. Pre-NBR (Fig. 10), representing vegetation conditions before a fire event, serves as a baseline for assessing the initial state of vegetation health. Areas with lower pre-NBR may indicate pre-existing stress or sparse vegetation, potentially influencing fire initiation. On the other hand, post-NBR reflects the severity of fire impact on vegetation, highlighting areas where the landscape has undergone significant changes. Comparing pre- and post-NBR (Fig. 11) allows for the identification of areas that experienced more substantial vegetation loss during a fire, aiding in the delineation of high-impact zones. High post-NBR values indicate severe burn severity, signaling heightened susceptibility in those regions. Conversely, areas with low post-NBR may suggest less severe burns or areas where the vegetation remained relatively intact. The temporal analysis of NBR, comparing conditions before and after a fire event, contributes to a dynamic understanding of fire susceptibility. This approach enhances the precision of mapping by considering the evolving landscape due to fire disturbances. Integrating pre- and post-NBR data into susceptibility mapping provides a valuable tool for identifying areas prone to severe vegetation loss and understanding the aftermath of wildfires. Pre- and post-NBR analysis (Fig. 12) in fire susceptibility mapping contributes to a nuanced evaluation of fire-prone areas. It enables the identification of regions with pre-existing vulnerabilities and offers insights into the severity of recent fire events. The integration of these indices enhances the overall accuracy of mapping, assisting in targeted mitigation efforts, resource allocation, and long-term landscape management strategies.
The northeast section of Gujarat, the coastline region of Saurashtra, and certain regions in Kutch have higher dNBR values (Fig. 12). Higher positive dNBR values imply a more severe burn, whereas lower or negative values indicate post-fire recovery or better vegetation. The higher dNBR readings in Gujarat’s northeast region, Saurashtra coastline region, and certain regions in Kutch indicate a greater severity of fire effect in certain areas. Analyzing dNBR values is critical for determining the level of fire damage, prioritizing post-fire recovery operations, and developing landscape restoration and fire control policies in affected regions.
LST
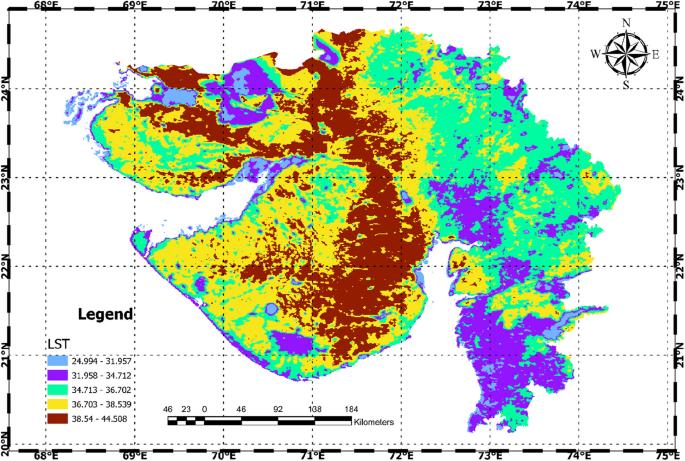
Land surface temperature (LST) is a crucial factor in fire susceptibility mapping, offering insights into thermal conditions that influence vegetation flammability. Elevated LST often corresponds to increased vegetation dryness, elevating the risk of ignition. Integrating LST into mapping enables the identification of areas experiencing persistent high temperatures, signaling heightened fire risk (Fig. 13). The relationship between LST and fire susceptibility is intricate, considering factors such as topography and land cover. Steep slopes and certain land covers may contribute to higher LST, indicating areas prone to rapid fire spread. Temporal analysis of LST adds a dynamic dimension, allowing for the assessment of seasonal variations and prolonged periods of elevated temperatures, contributing to a comprehensive understanding of fire susceptibility. The inclusion of LST in susceptibility mapping aids in prioritizing interventions, resource allocation, and developing effective strategies for wildfire prevention and management.
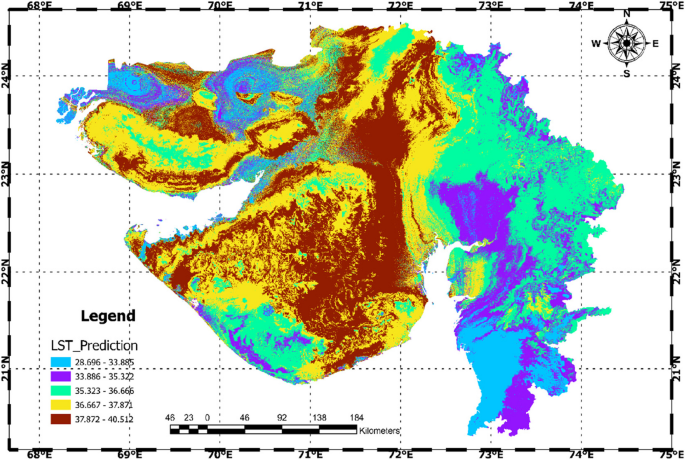
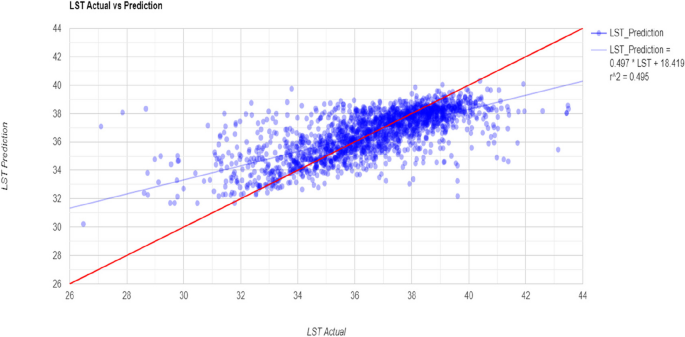
Land surface temperature (LST) prediction on Google Earth Engine (GEE) involves leveraging its vast computational capabilities and satellite imagery; sentinel data has been used for the same. Figure 14 illustrates the LST prediction map for Gujarat state. GEE provides a platform for processing, analyzing, and visualizing geospatial data, making it ideal for LST modeling. Utilizing machine learning algorithms and random forest was implemented on GEE to predict LST based on various input parameters. The process begins with data preprocessing, including atmospheric correction and feature selection. Subsequently, the algorithm is trained on historical temperature data to establish a predictive model. The trained model is then applied to new imagery for LST prediction and validated with actual LST (Fig. 15). GEE’s scalability allows for large-scale and temporal analyses, making it a powerful tool for dynamic LST mapping, and facilitating research in wildfire risk assessments. Figure 15 demonstrates the validation for predicted LST performed on GEE; results indicate a good amount of accuracy in the predicted LST with actual LST.
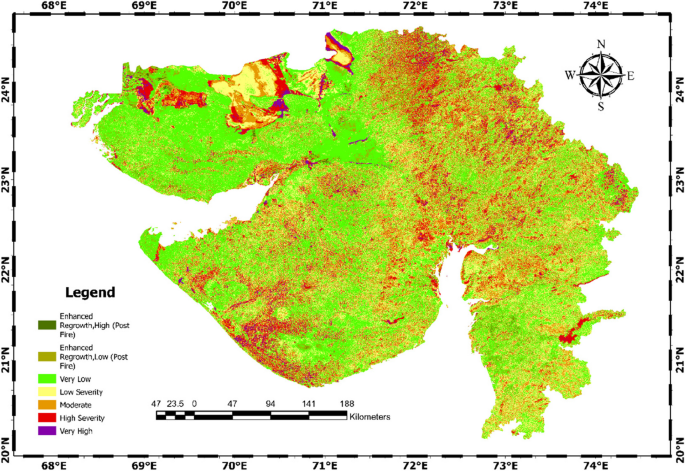
The fire susceptibility map on the Google Earth Engine is generated by combining normalized burn ratio (NBR) and land surface temperature (LST) with random forest (RF) and the map is illustrated in Fig. 16. Utilize GEE’s extensive satellite imagery dataset. Compute NBR and LST, integrate them, and select relevant features. Compile a training dataset with historical fire occurrences. Implement a random forest model on GEE, training it to predict susceptibility based on NBR, LST, and additional features. The fire susceptibility map was prepared with five classes very low, low severity, moderate, high severity, and very high as shown in Fig. 16. The major region under the study is susceptible to a very low to moderate risk of fire. Coastal regions of the Saurashtra peninsula, Central Gujarat, and some northern parts are susceptible to high risk of fire.
Discussions
Wildfires pose significant threats to ecosystems, human lives, and infrastructure globally, emphasizing the need for accurate prediction and effective management. Critical to mitigating the destructive impact of forest fires, preserving biodiversity, and safeguarding economic interests are effective interventions like early warning systems, community engagement, and robust legislation (Skole and Tucker 1993). The evaluation of fire susceptibility includes the analysis of seven essential factors (aspect, elevation, slope, NDVI, drainage density, precipitation, temperature) using Google Earth Engine (GEE). Furthermore, pre-NBR (normalized burn ratio) and post-NBR, along with land surface temperature (LST), were calculated using these identified factors. These factors played a vital role as input variables in the application of random forest for the mapping of fire susceptibility. A fire susceptibility map was generated, categorizing areas into five classes: very low, low severity, moderate, high severity, and very high (as illustrated in Fig. 16). The primary focus of the study reveals that the major region is prone to a risk ranging from very low to moderate. Notably, the coastal regions of the Saurashtra peninsula, Central Gujarat, and certain northern areas exhibit a higher susceptibility to the risk of fire.
Conclusion
To mitigate the catastrophic impact of wildfires, it is critical to correctly and rapidly detect active flames in their early stages. There are very few studies that focus on monitoring ongoing flames using AI-ML and geospatial techniques. A thorough assessment of wildfire susceptibility by implementing advanced methodology by integrating diverse environmental variables and leveraging cutting-edge machine learning techniques across Gujarat State, India. The present study meticulously analyzes various environmental variables, i.e., slope orientation, elevation, NDVI, drainage density, precipitation, and temperature to understand landscape characteristics and assess wildfire susceptibility. In addition, a sophisticated random forest regression model is used to predict land surface temperature (LST) based on a set of environmental parameters. The significant goal of the study is to utilize Google Earth Engine to compare places in Gujarat, India, before and after forest fires. High-resolution satellite data were used to assess the amount and types of changes caused by forest fires. The results of this study contribute to a better understanding of fire dynamics in this area by shedding light on the spatial distribution and severity levels of forest fires within the state. A more nuanced understanding of the susceptibility of different locations is made possible by the efficient application of a categorization model that divides fire severity into multiple levels: low, moderate, high, and very high. Densely wooded areas, particularly national parks and animal sanctuaries, were identified as hotspots for catastrophic fires, while open areas and non-forest regions had lower severity levels. Our findings emphasize the need for accurate forest fire severity estimations in guiding decision-making. Gujarat has efficient forest fire management measures. The resulting fire severity maps are useful decision-making tools, aiding resource allocation, rehabilitation planning, and the execution of targeted fire preventive and mitigation measures. By adopting the research’s insights, we go one step closer to constructing a more resilient and sustainable future in the face of the rising problems posed by forest fires. But it is important to understand the limitations of our approach. The availability and quality of the training and validation datasets have a direct impact on the classification model’s accuracy. Taking this into consideration, we feel that additional field validation and comparison with past fire data are essential steps toward enhancing the overall precision and dependability of our severity rating. Furthermore, this study was primarily concerned with assessing the intensity of forest fires and did not go into the underlying causes and drivers of forest fires in Gujarat. While our findings give a thorough picture of the spatial distribution and severity levels of forest fires in the region, future studies should seek to untangle the intricacies of the variables driving forest fires in the region. Taking these factors into account, our research serves as a basic step toward successful forest fire control in Gujarat. We set the ground for future developments in the discipline by identifying the strengths and limits of our research. The findings of this study offer decision-makers a helpful toolkit for developing evidence-based policies and strategies for maintaining ecosystems, saving biodiversity, and protecting communities from the ever-increasing threat of climate change Forest fires pose a risk. Moving forward, a commitment to continuous refinement and development of our approaches will be critical in promoting a more robust and sustainable coexistence with Gujarat’s changing landscapes.
Availability of data and materials
Data and material will be made available on reasonable request.
Abbreviations
- ALOS:
-
Advanced Land Observing Satellite
- BRTs:
-
Boosted regression trees
- CART:
-
Classification and regression trees
- CHIRPS:
-
Climate Hazards Group Infrared Precipitation with Station data
- DEM:
-
Digital Elevation Model
- dNBR:
-
Difference normalized burn ratio
- GEE:
-
Google Earth Engine
- GIS:
-
Geographic Information Systems
- LST:
-
Land surface temperature
- ML:
-
Machine learning
- NBR:
-
Normalized burn ratio
- NDVI:
-
Normalized difference vegetation index
- RF:
-
Random forest
- SRTM:
-
Shuttle Radar Topography Mission
- SVM:
-
Support vector machines
References
Abedi Gheshlaghi, H., B. Feizizadeh, and T. Blaschke. 2020. GIS-based forest fire risk mapping using the analytical network process and fuzzy logic. Journal of Environmental Planning and Management. 63 (3): 481–499. https://doi.org/10.1080/09640568.2019.1594726. Routledge.
Abhash, A., Tripathi, R.P., Omar, P.J., Gupta, N., and Pandey, K.K. 2023. Numerical Study of Flow Through Linear Weir. In: Pandey, M., Gupta, A.K., Oliveto, G. (eds) River, Sediment and Hydrological Extremes: Causes, Impacts and Management. Disaster Resilience and Green Growth. Singapore: Springer. https://doi.org/10.1007/978-981-99-4811-6_23.
Amatulli, G., M. J. Rodrigues, M. Trombetti, and R. Lovreglio. 2006. Assessing long-term fire risk at local scale by means of decision tree technique. Journal of Geophysical Research Biogeosciences. 111(4). https://doi.org/10.1029/2005JG000133. Blackwell Publishing Ltd.
Breiman, L. 2001. Random forests. Machine Learning 45: 5–32. https://doi.org/10.1023/A:1010933404324.
Bui, D. T., K. T. T. Le, V. C. Nguyen, H. D. Le, and I. Revhaug. 2016. Tropical forest fire susceptibility mapping at the Cat Ba National Park area, Hai Phong City, Vietnam, using GIS-based Kernel logistic regression. Remote Sens (Basel) 8(4). https://doi.org/10.3390/rs8040347. MDPI AG.
Chen, H. X., S. Zhang, M. Peng, and L. Zhang. 2016. A physically-based multi-hazard risk assessment platform for regional rainfall-induced slope failures and debris flows. Engineering Geology 203: 15–29. Elsevier B.V. https://doi.org/10.1016/j.enggeo.2015.12.009.
Chuvieco, E., D. Cocero, D. Riaño, P. Martin, J. Martínez-Vega, J. De La Riva, and F. Pérez. 2004. Combining NDVI and surface temperature for the estimation of live fuel moisture content in forest fire danger rating. Remote Sensing of Environment. 92: 322–331.
Cochrane, M. A. 2001. Society for Conservation Biology Synergistic Interactions between Habitat Fragmentation and Fire in Evergreen Tropical. Biology (Basel).
Eskandari, S., H. R. Pourghasemi, and J. P. Tiefenbacher. 2021. Fire-susceptibility mapping in the natural areas of Iran using new and ensemble data-mining models. Environmental Science and Pollution Research 28(34): 47395–47406. Springer Science and Businesshttps://doi.org/10.1007/s11356-021-13881-y. Media Deutschland GmbH.
Fowler, C. T. 2003. Human health impacts of forest fires in the southern United States: a literature review. Journal of Ecological Anthropology 7(1): 39–63. https://doi.org/10.5038/2162-4593.7.1.3.
Ghorbanzadeh, O., T. Blaschke, K. Gholamnia, and J. Aryal. 2019. Forest fire susceptibility and risk mapping using social/infrastructural vulnerability and environmental variables. Fire 2(3): 1–27. MDPI AG. https://doi.org/10.3390/fire2030050.
Gond, S., N. Gupta, P. K. S. Dikshit, and J. Patel. 2023a. Assessment of drought variability using SPEI under observed and projected climate scenarios over Uttar Pradesh, India. Physics and Chemistry of the Earth Parts A/B/C 131: 103440. https://doi.org/10.1016/j.pce.2023.103440.
Gond, S., N. Gupta, J. Patel, and P. K. S. Dikshit. 2023b. Spatiotemporal evaluation of drought characteristics based on standard drought indices at various timescales over Uttar Pradesh, India. Environmental Monitoring and Assessment 195(3): 439. https://doi.org/10.1007/s10661-023-10988-2.
Gorelick, N., M. Hancher, M. Dixon, S. Ilyushchenko, D. Thau, and R. Moore. 2017. Google Earth Engine: Planetary-scale geospatial analysis for everyone. Remote Sens Environ, 202: 18–27. Elsevier Inc. https://doi.org/10.1016/j.rse.2017.06.031.
Granström, A. 2001. Fire management for biodiversity in the European boreal forest. Scandinavian Journal of Forest Research 16(1): 62–69. Taylor and Francis A.S. https://doi.org/10.1080/028275801300090627.
Gupta, N., A. Banerjee, and S. K. Gupta. 2021a. Spatio-temporal trend analysis of climatic variables over Jharkhand, India. Earth Systems and Environment 5(1): 71–86. https://doi.org/10.1007/s41748-021-00204-x.
Gupta, N., P. K. Mahato, J. Patel, P. J. Omar, and R. P. Tripathi. 2022b. Understanding trend and its variability of rainfall and temperature over Patna (Bihar), 533–543: Current Directions in Water Scarcity Research: Water Resource Modeling and Computational Technologies. Elsevier. https://doi.org/10.1016/B978-0-323-91910-4.00030-3.
Gupta SK, Gupta N, Singh VP. 2021b. Variable-sized cluster analysis for 3D pattern characterization of trends in precipitation and change-point detection. Journal of Hydrologic Engineering 26(1): 04020056. https://doi.org/10.1061/(ASCE)HE.1943-5584.0002010.
Gupta, N., J. Patel, S. Gond, R. P. Tripathi, P. J. Omar, and P. K. S. Dikshit. 2023. Projecting future maximum temperature changes in River Ganges Basin using observations and statistical Downscaling Model (SDSM). In: Pandey, M., Azamathulla, H., Pu, J.H. (eds) River dynamics and flood hazards. Disaster resilience and green growth. Singapore: Springer. https://doi.org/10.1007/978-981-19-7100-6_31.
Gupta, N., S. Gond, and S. K. Gupta. 2022a. Spatiotemporal trend characteristics of rainfall and drought jeopardy over Bundelkhand Region, India. Arabian Journal of Geosciences 15(12): 1155. https://doi.org/10.1007/s12517-022-10389-8.
Gupta, N., J. Patel, N. Gupta, and A. Vishwakarma. 2022c. Urban organic waste as a source of bioenergy for electricity generation in Bhopal, Madhya Pradesh. IOP Conf Ser Earth Environ Sci 1084(1): 012024. https://doi.org/10.1088/1755-1315/1084/1/012024.
Hantson, S., S. Pueyo, and E. Chuvieco. 2015. Global fire size distribution is driven by human impact and climate. Global Ecology and Biogeography, 24 (1): 77–86. Blackwell Publishing Ltd. https://doi.org/10.1111/geb.12246.
Hernandez-Leal, P. A., M. Arbelo, and A. Gonzalez-Calvo. 2006. Fire risk assessment using satellite data. Advances in Space Research, 37 (4): 741–746. Elsevier Ltd. https://doi.org/10.1016/j.asr.2004.12.053.
Jaafari, A., and H. R. Pourghasemi. 2019. Factors influencing regional-scale wildfire probability in Iran. In Spatial modeling in GIS and R for Earth and Environmental sciences, 607–619. Elsevier.
Jodhani, K.H., Patel, D., Madhavan, N., Soni, U., Patel, H., and Singh, S.K. 2024. Channel planform dynamics using earth observations across Rel river, western India: A synergetic approach. Spat Inf Res. https://doi.org/10.1007/s41324-024-00573-1.
Jodhani, K. H., and D. Patel, N. Madhavan. 2023b. A review on analysis of flood modeling using different numerical models. Mater Today Proc 80: 3867–3876. https://doi.org/10.1016/j.matpr.2021.07.405.
Jodhani, K., P. Bansal, and P. Jain. 2021. Shoreline change and rate analysis of Gulf of Khambhat using Satellite images. Proceedings of the 4th International Conference: Innovative Advancement in Engineering & Technology (IAET). 151–170. https://doi.org/10.2139/ssrn.3552461.
Jodhani, K. H., D. Patel, and N. Madhavan. 2023a. Land Use Land Cover Classification for REL River Using Machine Learning Techniques. International Conference on IoT, Communication and Automation Technology (ICICAT) 1–3. IEEE. https://doi.org/10.1109/ICICAT57735.2023.10263663.
Jodhani, K. H., D. Patel, N. Madhavan, and S. K. Singh. 2023c. Soil Erosion Assessment by RUSLE, Google Earth Engine, and geospatial techniques over Rel River Watershed, Gujarat, India. Water Conservation Science and Engineering 8(1): 49. https://doi.org/10.1007/s41101-023-00223-x.
Kam Ho, T. 1995. Random Decision Forests. Proceedings of 3rd International Conference on Document Analysis and Recognition, Montreal, QC, Canada, 1995, pp. 278–282 vol.1, https://doi.org/10.1109/ICDAR.1995.598994.
Keenan, R. J., G. A. Reams, F. Achard, J. V. de Freitas, A. Grainger, and E. Lindquist. 2015. Dynamics of global forest area: Results from the FAO Global Forest resources Assessment 2015. In For Ecol Manage, Elsevier B.V.
Kim, S. J., C. H. Lim, G. S. Kim, J. Lee, T. Geiger, O. Rahmati, Y. Son, and W. K. Lee. 2019. Multi-temporal analysis of forest fire probability using socio-economic and environmental variables. Remote Sens (Basel) 11(1). https://doi.org/10.3390/rs11010086. MDPI AG.
Krasnow, K., T. Schoennagel, and T. T. Veblen. 2009. Forest fuel mapping and evaluation of LANDFIRE fuel maps in Boulder County, Colorado, USA. For Ecol Manage 257(7): 1603–1612. https://doi.org/10.1016/j.foreco.2009.01.020.
Kumar Jaiswal, R., S. Mukherjee, K. D. Raju, and R. Saxena. 2002. Forest fire risk zone mapping from satellite imagery and GIS. International Journal of Applied Earth Observation and Geoinformation 4 (1) 1–10. https://doi.org/10.1016/S0303-2434(02)00006-5.
Lecina-Diaz, J., J. Martínez-Vilalta, A. Alvarez, M. Banqué, J. Birkmann, D. Feldmeyer, J. Vayreda, and J. Retana. 2021. Characterizing forest vulnerability and risk to climate-change hazards. Front Ecol Environ, 19 (2): 126–133. Wiley Blackwell. https://doi.org/10.1002/fee.2278.
Ljubomir, G., D. Pamučar, S. Drobnjak, and H. R. Pourghasemi. 2019. Modeling the spatial variability of forest fire susceptibility using geographical information systems and the analytical hierarchy process. In Spatial modeling in GIS and R for Earth and Environmental sciences, 337–369. Elsevier.
Mckinley, D. C., M. G. Ryan, R. A. Birdsey, C. P. Giardina, M. E. Harmon, L. S. Heath, R. A. Houghton, R. B. Jackson, J. F. Morrison, B. C. Murray, D. E. Pataki, and K. E. Skog. 2011. A synthesis of current knowledge on forests and carbon storage in the United States. Ecological Applications 21(6): 1902–24. https://doi.org/10.1890/10-0697.1.
Moayedi, H., M. Mehrabi, D. T. Bui, B. Pradhan, and L. K. Foong. 2020. Fuzzy-metaheuristic ensembles for spatial assessment of forest fire susceptibility. J Environ Manage 260. Academic Press. https://doi.org/10.1016/j.jenvman.2019.109867.
Molina, J. R., A. González-Cabán, and F. Rodríguez y Silva. 2019. Wildfires impact on the economic susceptibility of recreation activities: Application in a Mediterranean protected area. J Environ Manage 245: 454–463. Academic Press. https://doi.org/10.1016/j.jenvman.2019.05.131.
Omar, P. J., and V. Kumar. 2021. Land surface temperature retrieval from TIRS data and its relationship with land surface indices. Arabian Journal of Geosciences 14(18): 1897. https://doi.org/10.1007/s12517-021-08255-0.
Omar, P. J., N. Gupta, R. P. Tripathi, and S. Shekhar,S. 2017. A study of change in agricultural and forest land in Gwalior city using satellite imagery. SAMRIDDHI: A Journal of Physical Sciences Engineering and Technology 9(02): 109–112. https://doi.org/10.18090/samriddhi.v9i02.10870.
Omar, P. J., S. P. Rai, and H. Tiwari. 2022. Study of morphological changes and socio-economic impact assessment: a case study of Koshi River. Arabian Journal of Geosciences 15(17): 1426. https://doi.org/10.1007/s12517-022-10723-0.
Pourghasemi, H. R. 2016. GIS-based forest fire susceptibility mapping in Iran: A comparison between evidential belief function and binary logistic regression models. Scandinavian Journal of Forest Research 31(1): 80–98. Taylor and Francis AS. https://doi.org/10.1080/02827581.2015.1052750.
Pourghasemi, H. R., A. Gayen, M. Edalat, M. Zarafshar, and J. P. Tiefenbacher. 2020. Is multi-hazard mapping effective in assessing natural hazards and integrated watershed management? Geoscience Frontiers 11(4): 1203–1217. Elsevier B.V. https://doi.org/10.1016/j.gsf.2019.10.008.
Pourghasemi, H., M. reza, Beheshtirad, and B. Pradhan. 2016. A comparative assessment of prediction capabilities of modified analytical hierarchy process (M-AHP) and Mamdani fuzzy logic models using Netcad-GIS for forest fire susceptibility mapping. Geomatics, Natural Hazards and Risk, 7 (2): 861–885. Taylor and Francis Ltd. https://doi.org/10.1080/19475705.2014.984247.
Pourtaghi, Z. S., H. R. Pourghasemi, R. Aretano, and T. Semeraro. 2016. Investigation of general indicators influencing on forest fire and its susceptibility modeling using different data mining techniques. Ecol Indic 64: 72–84. Elsevier B.V. https://doi.org/10.1016/j.ecolind.2015.12.030.
Ray, K., and J.R. Chincholikar. 2013. Analysis of extreme high temperature conditions over Gujarat. MAUSAM 64 (3): 467–474. https://doi.org/10.54302/mausam.v64i3.728.
Satir, O., S. Berberoglu, and C. Donmez. 2016. Mapping regional forest fire probability using artificial neural network model in a Mediterranean forest ecosystem. Geomatics, Natural Hazards and Risk, 7 (5): 1645–1658. Taylor and Francis Ltd. https://doi.org/10.1080/19475705.2015.1084541.
Shabani, S., A. Jaafari, and P. Bettinger. 2021. Spatial modeling of forest stand susceptibility to logging operations. Environ Impact Assess Rev, 89. Elsevier Inc. https://doi.org/10.1016/j.eiar.2021.106601.
Siegert, F. G. Ruecker, A. Hinrichs, and A. A. Hoffmannk. 2001. Increased damage from fires in logged forests during droughts caused by El Niño. Nature 414(6862): 437–40. https://doi.org/10.1038/35106547.
Singh, A. N., A. Mudgal, R. P. Tripathi, and P. J. Omar. 2023. Assessment of wastewater treatment potential of sand beds of River Ganga at Varanasi, India. AQUA — Water Infrastructure Ecosystems and Society 72(5): 690–700. https://doi.org/10.2166/aqua.2023.200.
Skole, D., and C. Tucker. 1993. Tropical deforestation and habitat fragmentation in the Amazon: Satellite data from 1978 to 1988. Science 260(5116): 1905–10. https://doi.org/10.1126/science.260.5116.1905.
Surbhi Singh, S., and C. Jeganathan. 2023. Using ensemble machine learning algorithm to predict forest fire occurrence probability in Madhya Pradesh and Chhattisgarh, India. Advances in Space Research. https://doi.org/10.1016/j.asr.2023.12.054.
Shivhare, N., P. J. Omar, N. Gupta, and P. K. S. Dikshit. 2016. Runoff estimation of Banaras Hindu University South Campus using ArcGIS and HecGeo-HMS. 3rd International Conference on Recent Advances in Information Technology (RAIT), IEEE. 607–612. https://doi.org/10.1109/RAIT.2016.7507968.
Teodoro, A. C., and L. Duarte. 2013. Forest fire risk maps: a GIS open source application - a case study in Norwest of Portugal. International Journal of Geographical Information Science 27(4): 699–720. https://doi.org/10.1080/13658816.2012.721554.
Van Wagtendonk, J. W., R. R. Root, and C. H. Key. 2004. Comparison of AVIRIS and Landsat ETM + detection capabilities for burn severity. Remote Sens Environ, Elsevier 92: 397–408. https://doi.org/10.1016/j.rse.2003.12.015.
Verde, J. C., and J. L. Zêzere. 2010. Natural hazards and Earth System Sciences Assessment and validation of wildfire susceptibility and hazard in Portugal. Hazards Earth Syst Sci
Wotton, B. M., C. A. Nock, and M. D. Flannigan. 2010. Forest fire occurrence and climate change in Canada. International Journal Wildland Fire 19(3): 253–271. https://doi.org/10.1071/WF09002.
Acknowledgements
The authors acknowledge the support of Nirma University.
Funding
Funding information is not applicable. No funding was received.
Author information
Authors and Affiliations
Contributions
Conceptualization: Keval H Jodhani (KHJ), Haard Patel (HP), Utsav Soni (US), Rishabh Patel (RP), Bhairavi Valodara (BV), Nitesh Gupta (NG), Anant Patel (AP), Padam jee Omar (PJO); methodology: KHJ, NG, AP, PJO; formal analysis: HP, US, RP, BV; investigation: KHJ, HP, US, NG; data curation: KHJ, HP, US, AP; visualization: KHJ, HP, US, RP, BV; writing original draft preparation: KHJ, HP, US, RP, BV, NG, AP, PJO; writing, review and editing: KHJ, NG, AP, PJO. All authors have read and agreed to publish the manuscript.
Corresponding author
Ethics declarations
Ethics approval and consent to participate
The authors followed the ethical guidelines, no ethical approval was required, and all the authors agreed to participate.
Consent for publication
All authors are agreeing to publish the content.
Competing interests
The authors declare no competing interests.
Additional information
Publisher’s Note
Springer Nature remains neutral with regard to jurisdictional claims in published maps and institutional affiliations.
Rights and permissions
Open Access This article is licensed under a Creative Commons Attribution 4.0 International License, which permits use, sharing, adaptation, distribution and reproduction in any medium or format, as long as you give appropriate credit to the original author(s) and the source, provide a link to the Creative Commons licence, and indicate if changes were made. The images or other third party material in this article are included in the article's Creative Commons licence, unless indicated otherwise in a credit line to the material. If material is not included in the article's Creative Commons licence and your intended use is not permitted by statutory regulation or exceeds the permitted use, you will need to obtain permission directly from the copyright holder. To view a copy of this licence, visit http://creativecommons.org/licenses/by/4.0/.
About this article
Cite this article
Jodhani, K.H., Patel, H., Soni, U. et al. Assessment of forest fire severity and land surface temperature using Google Earth Engine: a case study of Gujarat State, India. fire ecol 20, 23 (2024). https://doi.org/10.1186/s42408-024-00254-2
Received:
Accepted:
Published:
DOI: https://doi.org/10.1186/s42408-024-00254-2
